1. General Features
Introduction
 3D plot
xvortices is a python package built on xarray (starts with an x), targeting at extracting information about moving vortices from lat/lon gridded datasets. Moving vortices include tornado, tropical cyclone, extratropical cyclone, polar vortex in the atmospheric context, as well as mesoscale eddy and ocean gyre in the oceanic context. These moving vortices are usually described in a moving (also known as quasi-Lagrangian) cylindrical coordinate. As the coordinate system moves on the spherical earth as a whole, one could take a view of the vortex dynamics from a quasi-Lagrangian perspective instead of the traditional Eulerian perspective.
Basically, this package would do the following jobs:
accept an
xarray.Dataset(or a list ofxarray.DataArray) as an input dataset, usually in a fashion of lat/lon grid;interpolate the data onto the cylindrical coordinates once the origin of the moving coordinate is given (this is naturally done using the builtin function of
xarray);return the interpolated fields, including scalars and vectors;
re-project the vectors onto the azimuthal/radial directions;
With this tool, one can perform quasi-Lagrangian diagnoses of the structure, evolution, budget, intensity etc in a perspective different from the Eulerian one.
Features
Make use of xarray’s functionality
xvortices is built on xarray, which means that all the inputs and outputs are already structured in xarray.DataArray. As a result, one can easily open a NetCDF dataset, feed the lat/lon data variables into xvortices, and then get the interpolated data variables defined on cylindrical coordinates. The whole interpolation is accomplished using xarray’s linear interpolation functionality, and thus easily generalized to 4D dataset as (time, level, lat, lon) => (time, level, radial, azimuth). In addition, xarray also make the coordinate transform of a very large dataset efficient and possible because of its integration with dask for parallel and out-of-core computing.
Cylindrical coordinates on spherical earth
The cylindrical coordinates describing the moving vortices are defined on the spherical earth rather than Cartesian coordinate. Note that only the horizontal coordinates is transformed (2D lat/lon to radial/azimuthal), the vertical and time coordinates are not modified at all. The 2D cylindrical coordinates on the spherical earth, with ($\eta$, $\beta$) representing the azimuthal and radial directions, are defined in the following figure.
 cylind
Note that $\eta$ is defined as the angle started from the local north direction, rotating anti-clockwise to the radial direction. The radial angle $\beta$ starts from the center of the coordinates and pointed to a local cylindrical point. So if the cylindrical coordinates coinside with the South Pole, ($\eta$, $\beta$) of a point on earth will be equivalent to (lon, $-\pi/2$+lat).
Quick 3D view of a vortex
Since xvortices makes use of xarray, the interpolated data variables on cylindrical coordinates can be easily plotted. The package also provides a 3D plot function that allows a quick 3D view of a vortex structure.
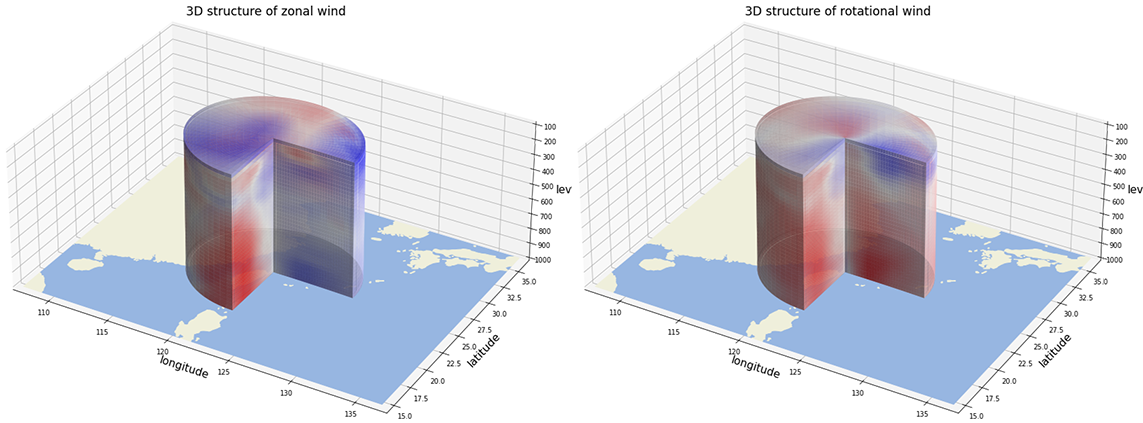 3D cylind